- Overview
- Latest Release Notes
- Historical Release Notes
- About ENCOO RPA Studio
- Product Introduction
- Quick Start
- Version Control
- Extension
- ENCOO Market
- FAQ
- ENCOO Component Library
- ENCOO RPA Robot
- ENCOO RPA Console
- Q&A
- LEGAL NOTICES
本文内容导航
Debug
Debugging is a powerful feature and it is the process of identifying and fixing errors in an edited automation project that prevent it from running successfully, either manually or automatically, before putting it into actual use, which is an important step in ensuring the correctness of an automation project.
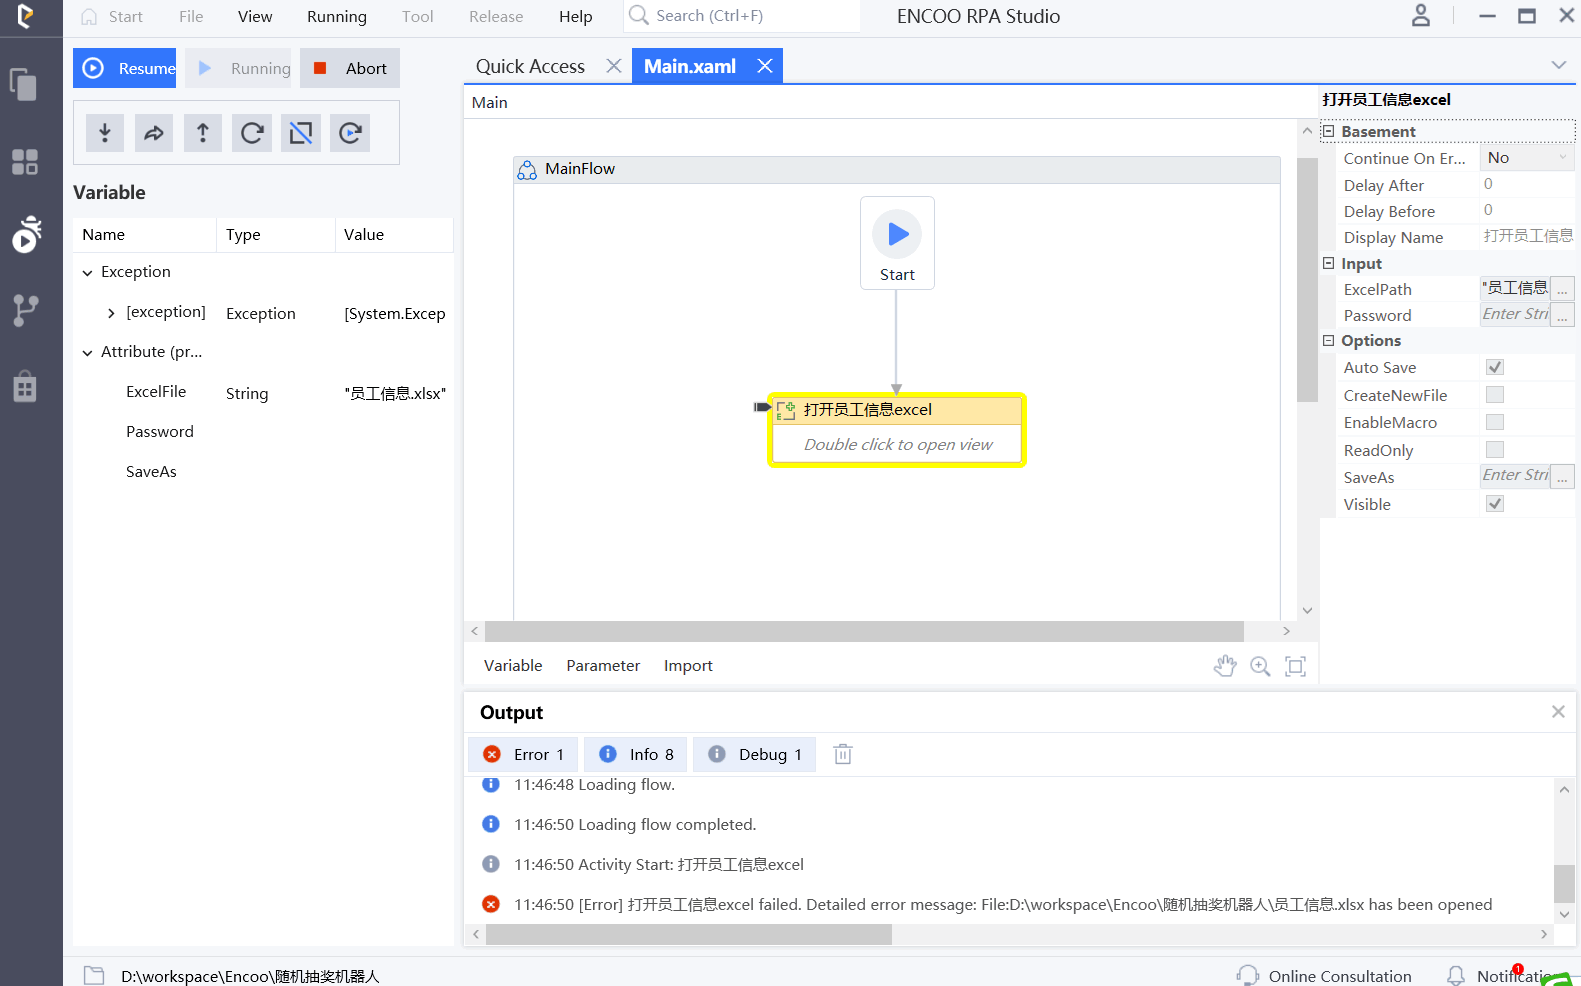
You can use several debugging actions under the Run panel to perform debugging, and you can also view the specific process of debugging through other related panels.

Debugging Actions
You can start debugging by clicking the "Debug" button in the Run panel, or with the F5 shortcut.
Note:
Debugging can be started only when there are no errors in the automation project.
- Resume
When debugging is started, the whole flow will be paused at the first breakpoint, at which point you can select "Resume" to resume running to the next breakpoint and pause debugging.
The "Resume" action can be used with the "F5" shortcut.
- Pause
When you are in the debugging process, you can select "Pause" to pause the debugging process at any moment.
The "Pause" action can be used with the "F5" shortcut.
- Abort
When you are in the debugging process, you can select "Abort" to abort the debugging process.
The "Abort" action can be used with the "Shift + F5" shortcut.
- Step Into
Use "Step Into" to execute the flow step by step and debug one activity at a time.
The "Step Into" action can be used with the "F11" shortcut.
- Step Over
When "Step Over" is used for debugging, the current container class activity is not opened, but the next activity is debugged directly. This option allows you to skip the flow blocks that you are not interested in, so that you can quickly move to a more interesting flow block.
The "Step Out" action can be used with the "F10" shortcut.
- Step Out
When "Step Out" is used for debugging, the current container class activity will be stepped out and debugging will be paused. The execution of activities in the current container will be completed, before pausing the debugging.
The "Step Over" action can be used with the "Shift + F11" shortcut.
Set Breakpoint for Debugging
You can set breakpoint in Studio. During the debugging process, when a breakpoint is encountered, the debugging will be automatically paused.
- Insert and Delete Breakpoint
- Select an activity, right click to open the menu, select Breakpoint -> Insert Breakpoint to insert a breakpoint; select Breakpoint -> Delete Breakpoint to delete the breakpoint
- Select an activity and use the "F9" shortcut to insert a breakpoint; using "F9" again will delete the breakpoint
After inserting a breakpoint, a red dot will appear in the upper left corner of the activity.

When debugging, execution will be paused at the breakpoint and the activity set with breakpoint will be highlighted.

- Disable and Enable Breakpoint
After inserting a breakpoint, you can disable or reenable the breakpoint through the following methods:
- Select an activity, right click to open the menu, select Breakpoint -> Disable Breakpoint to disable a breakpoint; select Breakpoint -> Enable Breakpoint to reenable the breakpoint
- Select an activity and use the "Ctrl + F9" shortcut to disable a breakpoint; using "Ctrl + F9" shortcut again will reenable the breakpoint
After disabling a breakpoint, the red dot in the upper right corner of the activity will become a hollow circle.


